Web app
GitHub Analytics Dashboard
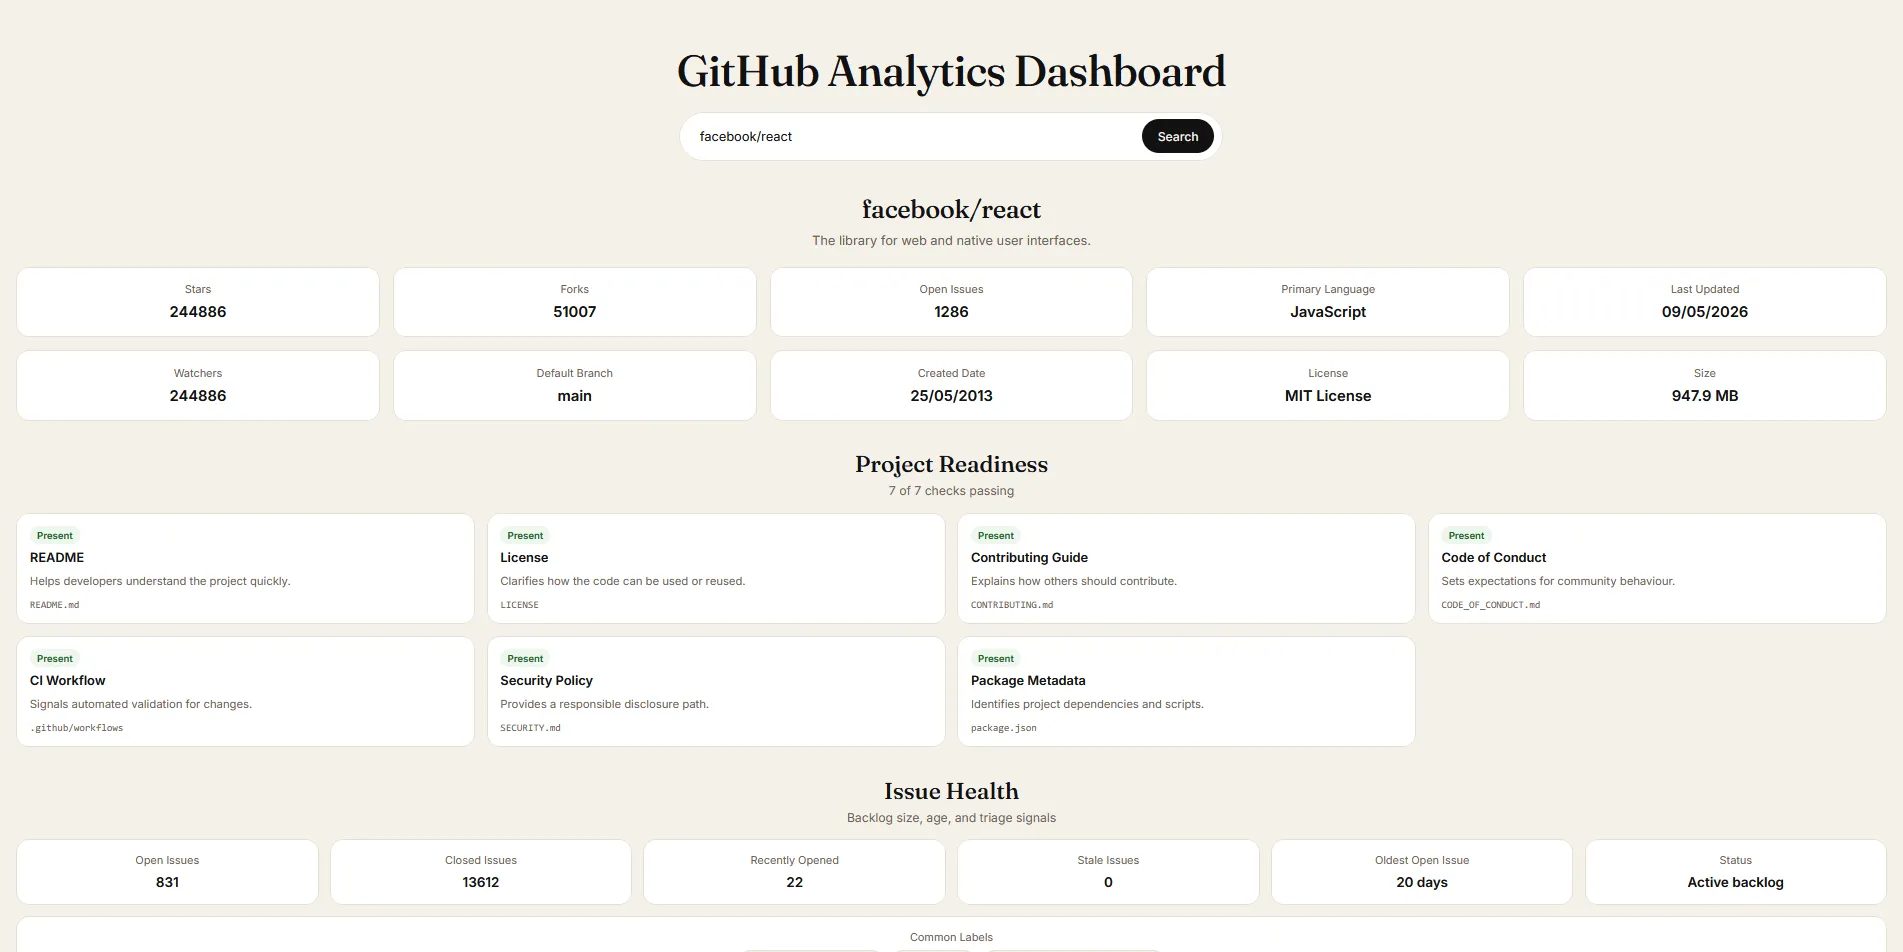
A React dashboard that turns GitHub repository data into practical signals about activity, maintainability, readiness and project health.
Why I built it
While exploring repositories on GitHub, I noticed it was easy to find raw statistics but much harder to understand the overall health of a project. A repository could look active at first glance while being difficult to contribute to, poorly documented or abandoned beneath the surface.
I wanted to turn that scattered data into something readable: clear signals that help developers understand a project quickly, rather than isolated metrics.
It was also a chance to deepen my understanding of API integration, frontend architecture, data visualisation and interface design on something practical rather than tutorial-based.
Key features
- Turns any public repository into a structured dashboard of activity, maintainability, readiness and issue health.
- Surfaces readiness checks that are easy to miss: README, licence, contribution guide, security policy, CI workflow and package metadata.
- Analyses issue health and backlog momentum: recently opened and stale issues, the oldest open issue and backlog status.
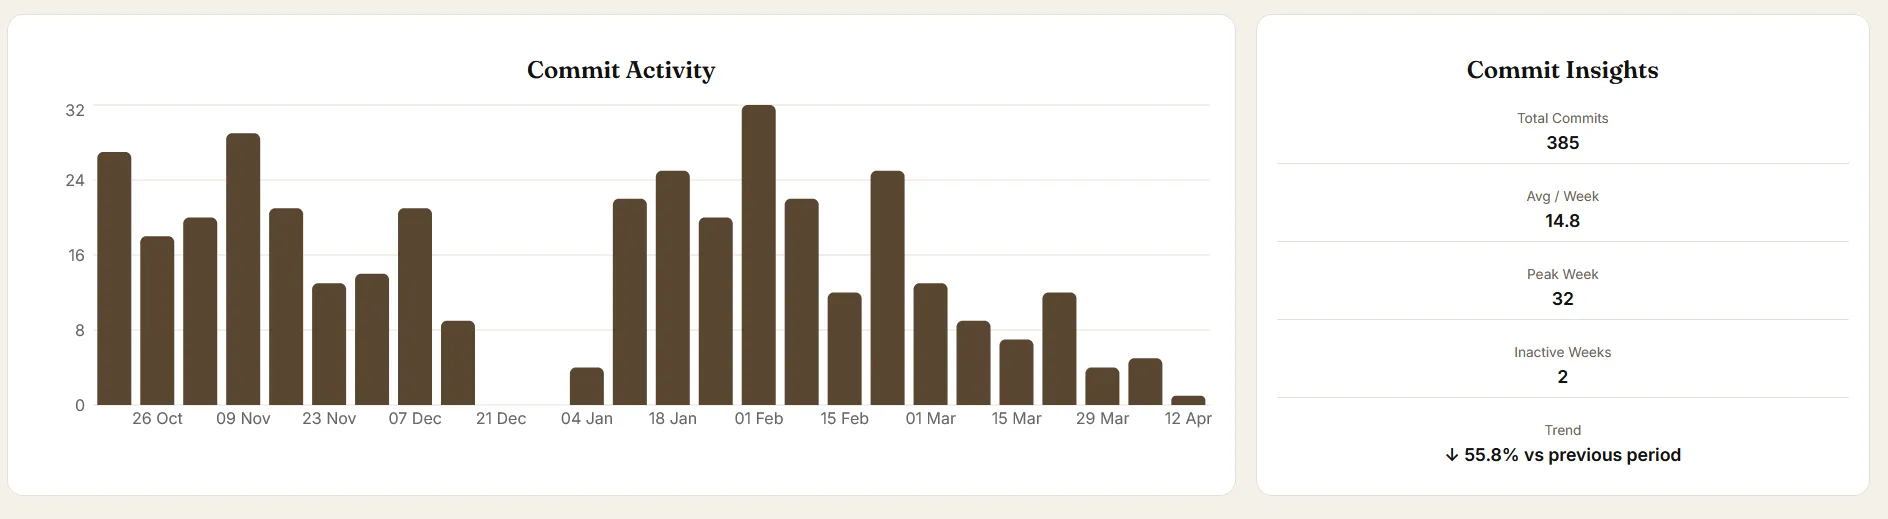
- Visualises commit activity over time to show development rhythm, quiet periods, peak weeks and recent trends.
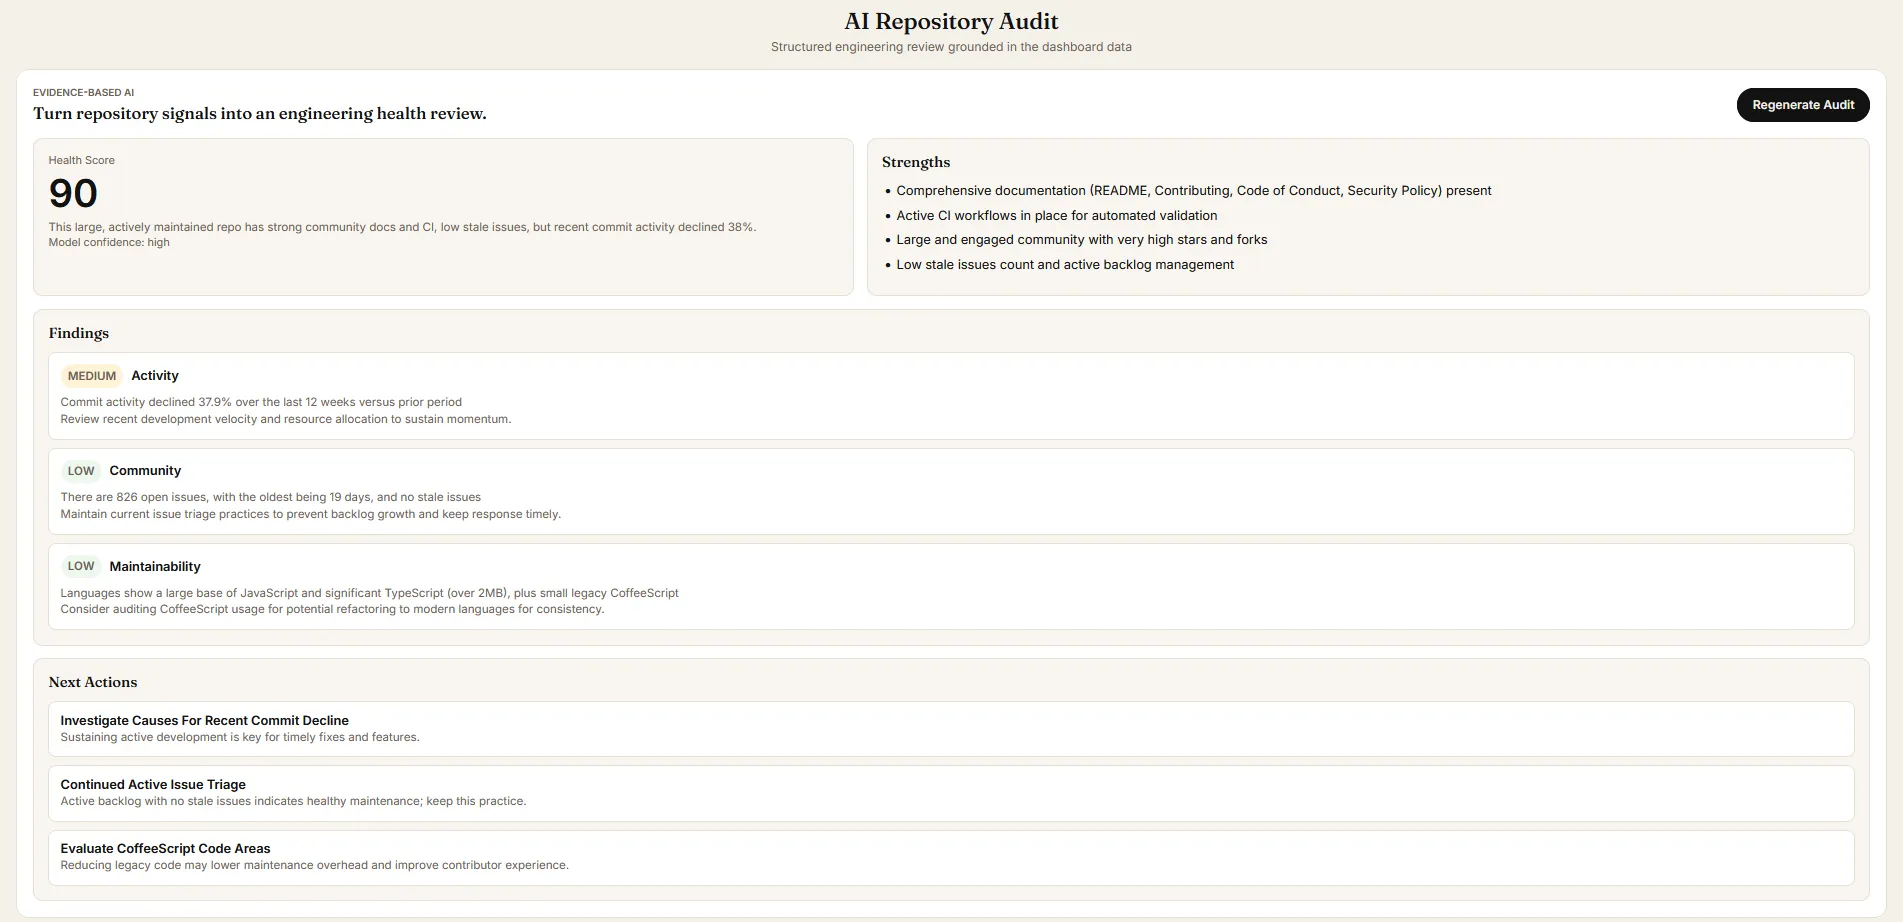
- An AI repository audit that turns an analytics snapshot into a structured engineering review, using schema-constrained JSON output.
- GitHub and OpenAI calls run behind server-side functions, so no API token is ever exposed in the browser.
Challenges and what I learned
- The hardest part was deciding which signals actually mattered. It was easy to keep adding API data and charts, and much harder to keep the result readable.
- Building it shifted my thinking from displaying data to communicating it: a good interface helps people see what matters without overwhelming them.
- Responsive design was a real challenge. Dense statistic cards crowded quickly on mobile, which forced careful decisions about spacing, hierarchy and what deserved attention first.
Technical decisions
- React and Vite kept the frontend light and quick to iterate on, and made it natural to split the dashboard into reusable sections.
- Data fetching is separated from presentation, so API concerns, loading states and display logic don’t tangle as the dashboard grows.
- The interface is organised around grouped health signals rather than raw API responses, so people can scan it from different angles.
- Productionised with CI, Dependabot, a licence, a security policy and contributor documentation.
What I would do differently
GitHub’s commit activity data covers roughly 52 weeks, so longer trend views aren’t reliable. I’d design that section around the data that exists and explain the limit in the interface.
I’d add stronger empty states, clearer explanations for each health signal and better scoring logic, so people understand why a result matters rather than only whether it passed.
Screenshots